
Home / Indicators
The toolkit · $40 / monthSix indicators.
One way of reading price.
These are the building blocks every EthosAlgo strategy is made of. Each one draws exactly what ICT describes — an imbalance, an inversion, a breaker, a divergence, a raid — measured in ticks and confirmed on closed bars, not approximated by a moving average.
Fair Value Gap
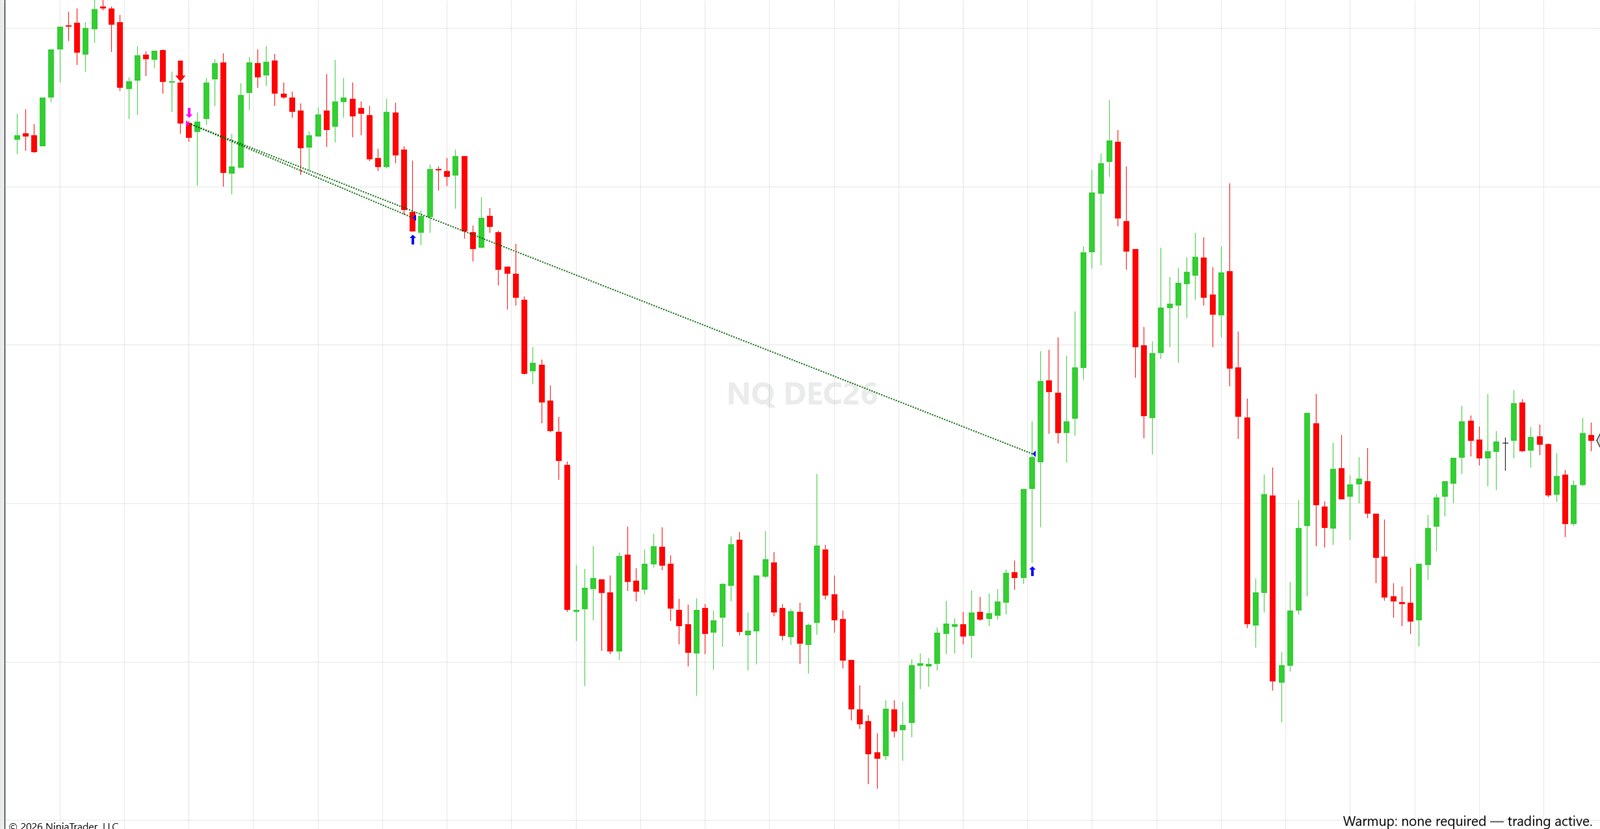
The imbalance price left behind. Three candles, one unfilled range, and a zone that price tends to revisit before it continues. The indicator finds every one of them, keeps the ones that matter, and tells you when they've been used.
- Size filters in ticks — a minimum and a maximum, so micro-gaps and news candles don't clutter the chart
- Touch counting — require one, two or more touches before a zone is considered consumed
- Fill state — untouched, partially filled and completed gaps are drawn differently
- Completion lines — the exact level where the imbalance was closed
- Lookback in days — keep the chart clean without losing yesterday's context
Inversion Fair Value Gap
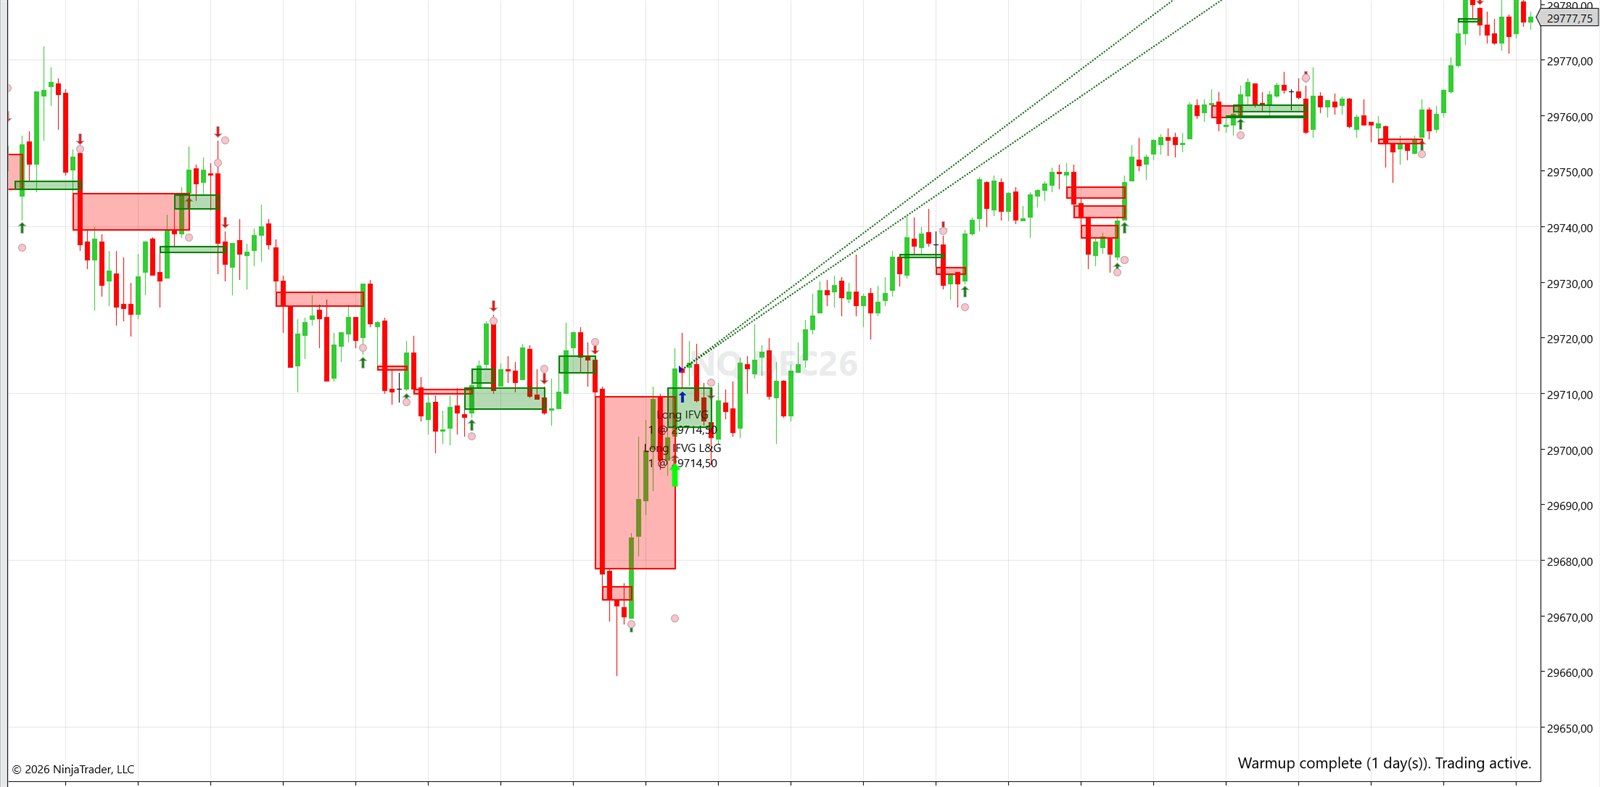
When a bullish gap fails and price closes through it, that gap becomes resistance. The inversion is one of the cleanest tells in the entire ICT framework — and it is the trigger behind the Venom model.
- Real closes only — an inversion requires a close through the gap, with a configurable margin in ticks
- Support flips to resistance — inverted bullish and bearish zones are coloured separately
- Entry arrows and stop dots — the level the algorithm would use, drawn as it happens
- Minimum gap size — filter out inversions too small to be worth the risk
- Master drawing switch — hide every object while the logic keeps running underneath
Breaker
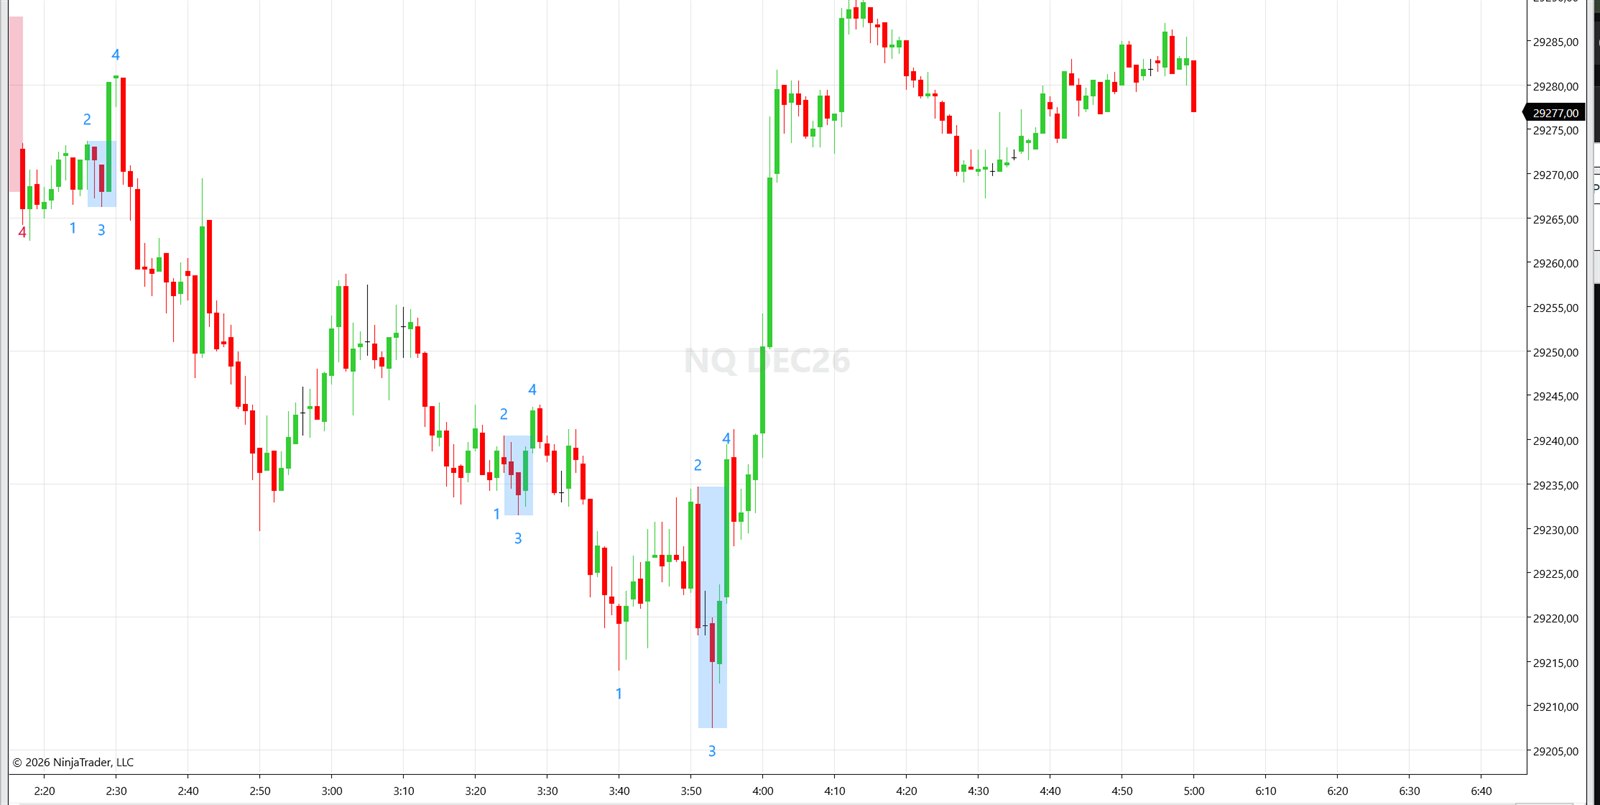
ICT's 1-2-3-4 sequence, found and labelled automatically: the swing that formed, the liquidity that was taken, the break of structure that followed, and the candle body that becomes your entry block when price returns to it.
- Numbered sequence — every leg of the pattern is labelled 1, 2, 3, 4 on the chart
- Swing strength control — decide how significant a swing must be to qualify
- Bullish and bearish blocks — the breaker zone is drawn and held until it is invalidated
- Directional filtering — show only the breakers that agree with your higher-timeframe bias
- Unicorn detection — when a breaker overlaps a fair value gap, the strongest version of the setup
SMT Divergence
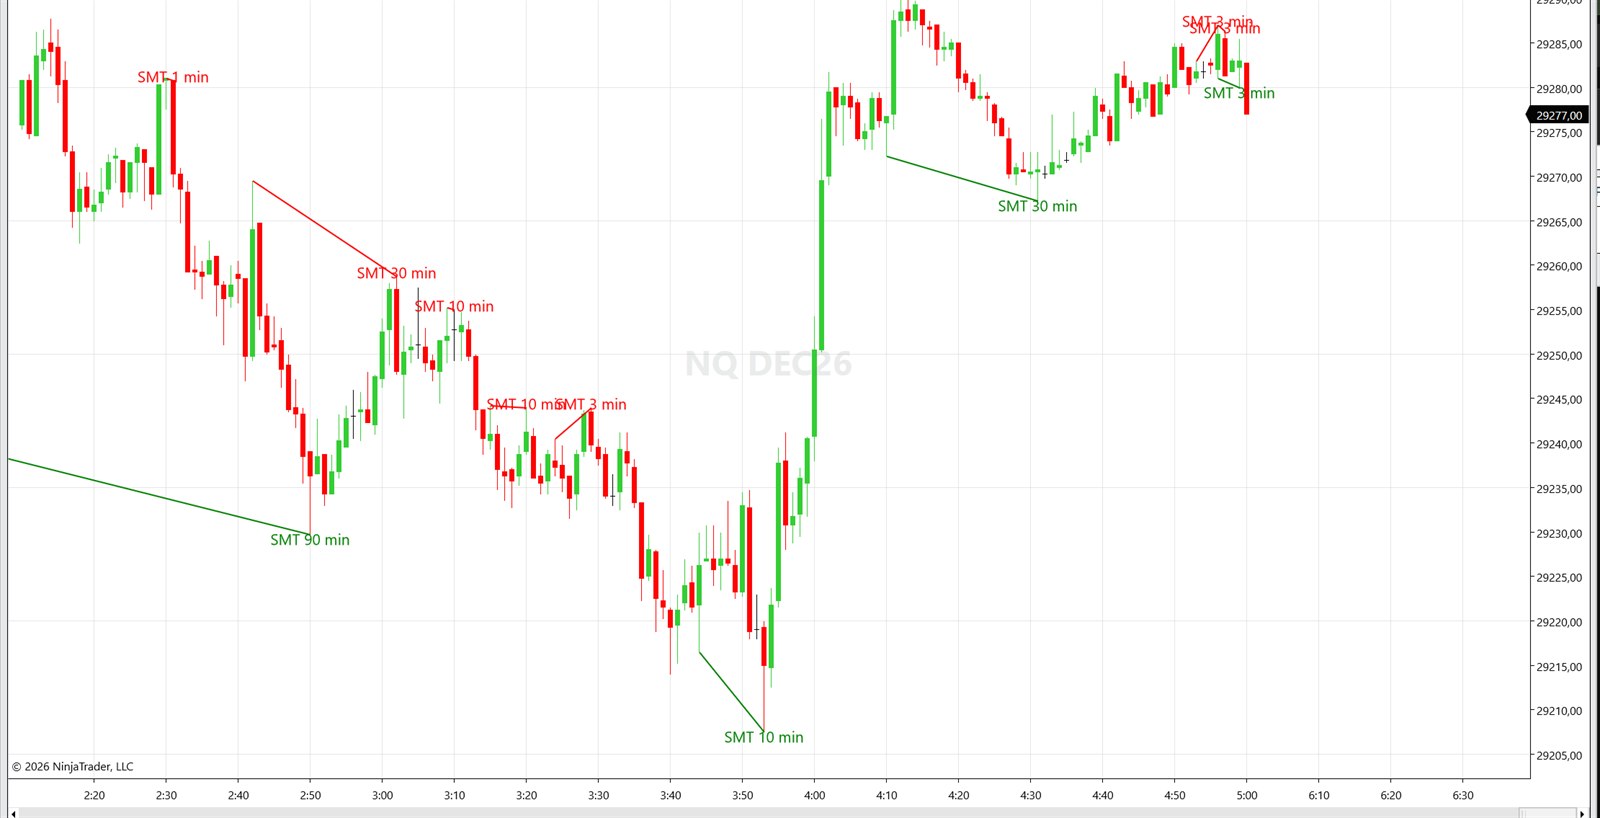
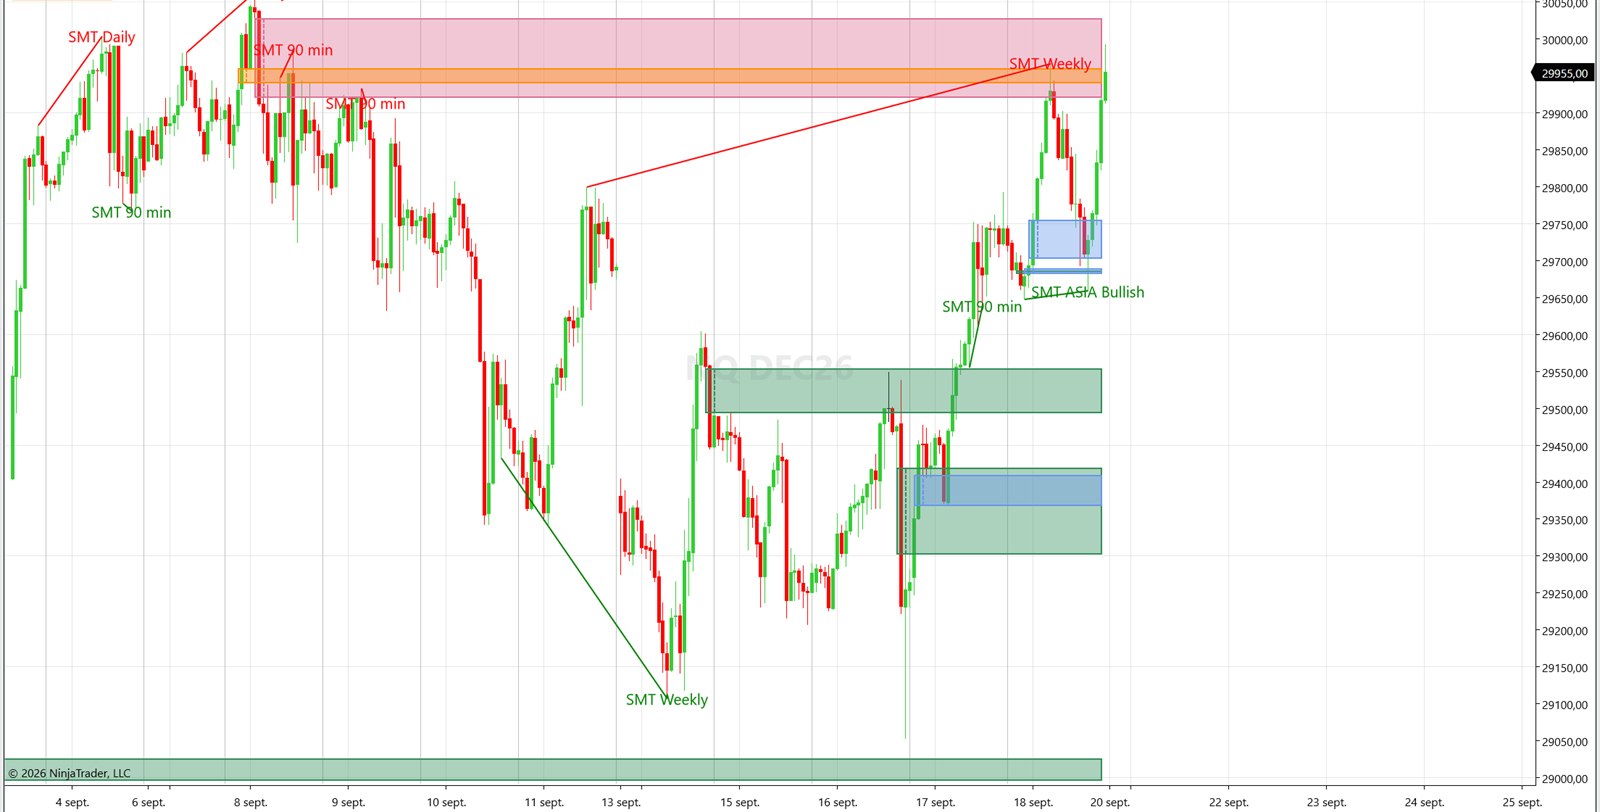
NQ makes a lower low, ES does not. That disagreement is smart money leaving a footprint — and this indicator watches for it on every timeframe at once, comparing your chart to a correlated instrument bar for bar.
- Nine timeframes — 1, 3, 10, 30 and 90 minutes, plus daily, weekly, monthly and quarterly, each toggled independently
- Session divergences — dedicated Asia and London detection for the killzone traders
- Any comparison instrument — NQ against ES by default, or whichever pair you trade
- Time-matching window — swings are aligned in real time, not by bar index, so the comparison is honest
- Confirmation bars — require the divergence to hold before it is drawn
- Labelled lines — every divergence is drawn and named with the timeframe that produced it
Higher-timeframe FVG, IFVG & Breaker
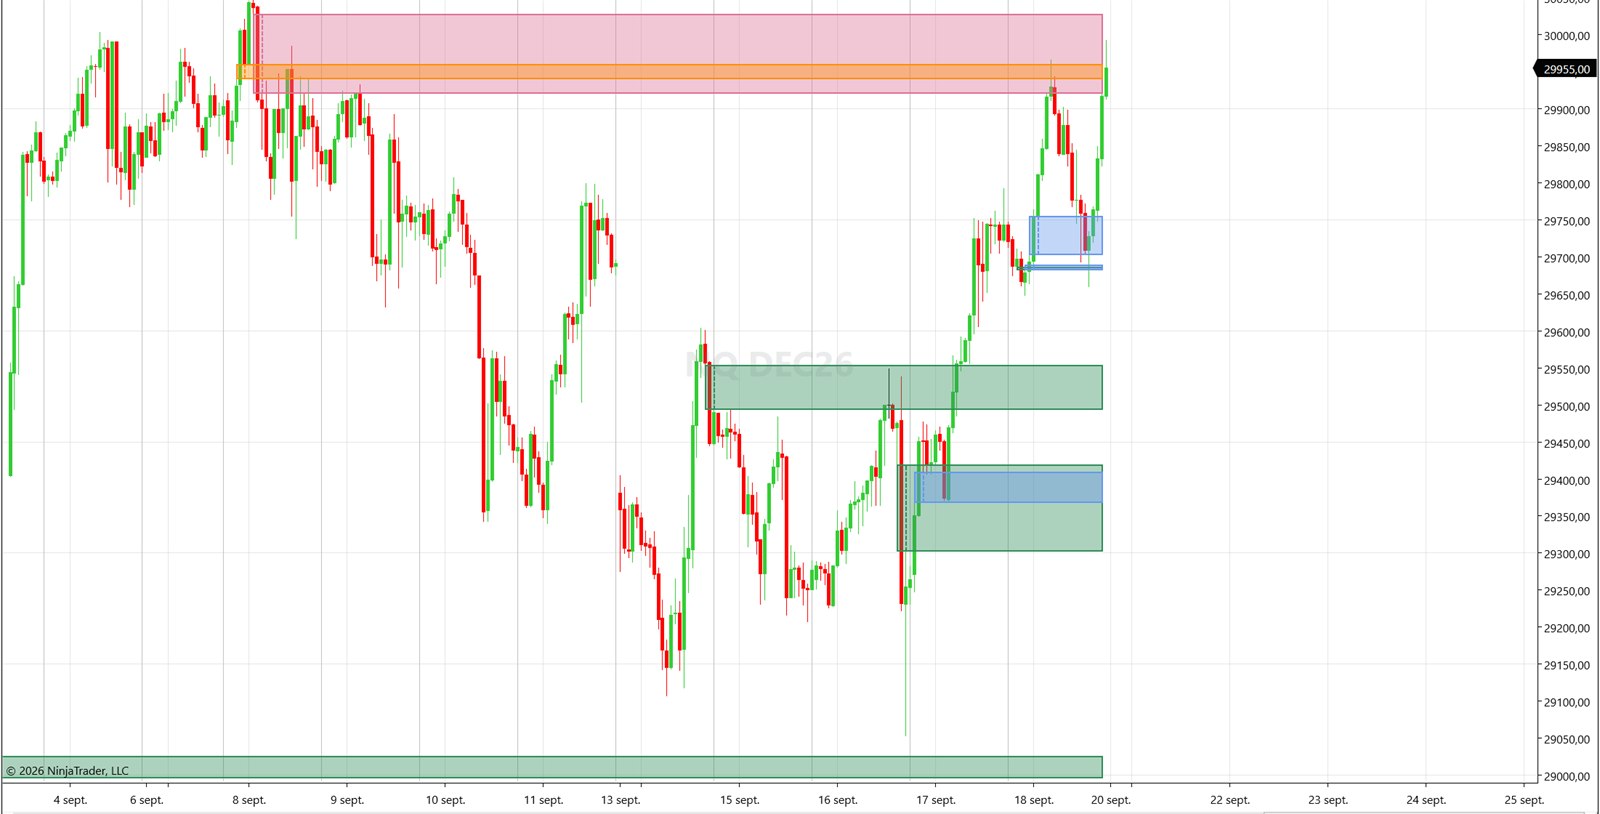
Execution happens on the 1-minute chart. Decisions happen on the 90-minute one. This overlay projects higher-timeframe gaps, inversions and breakers straight onto your execution chart, so an entry never fires blind into a level that outranks it.
Any HTF period
Set the higher timeframe in minutes — 60, 90, 240, daily — and the zones are rebuilt from that series, not resampled from your chart.
HTF break confirmation
Require the inversion to be confirmed by a close on the higher timeframe, with its own tick margin, before the zone flips.
Display modes
Show untouched gaps only, include filled ones, draw completion lines, control opacity — one overlay that never buries the candles.
Liquidity Sweep
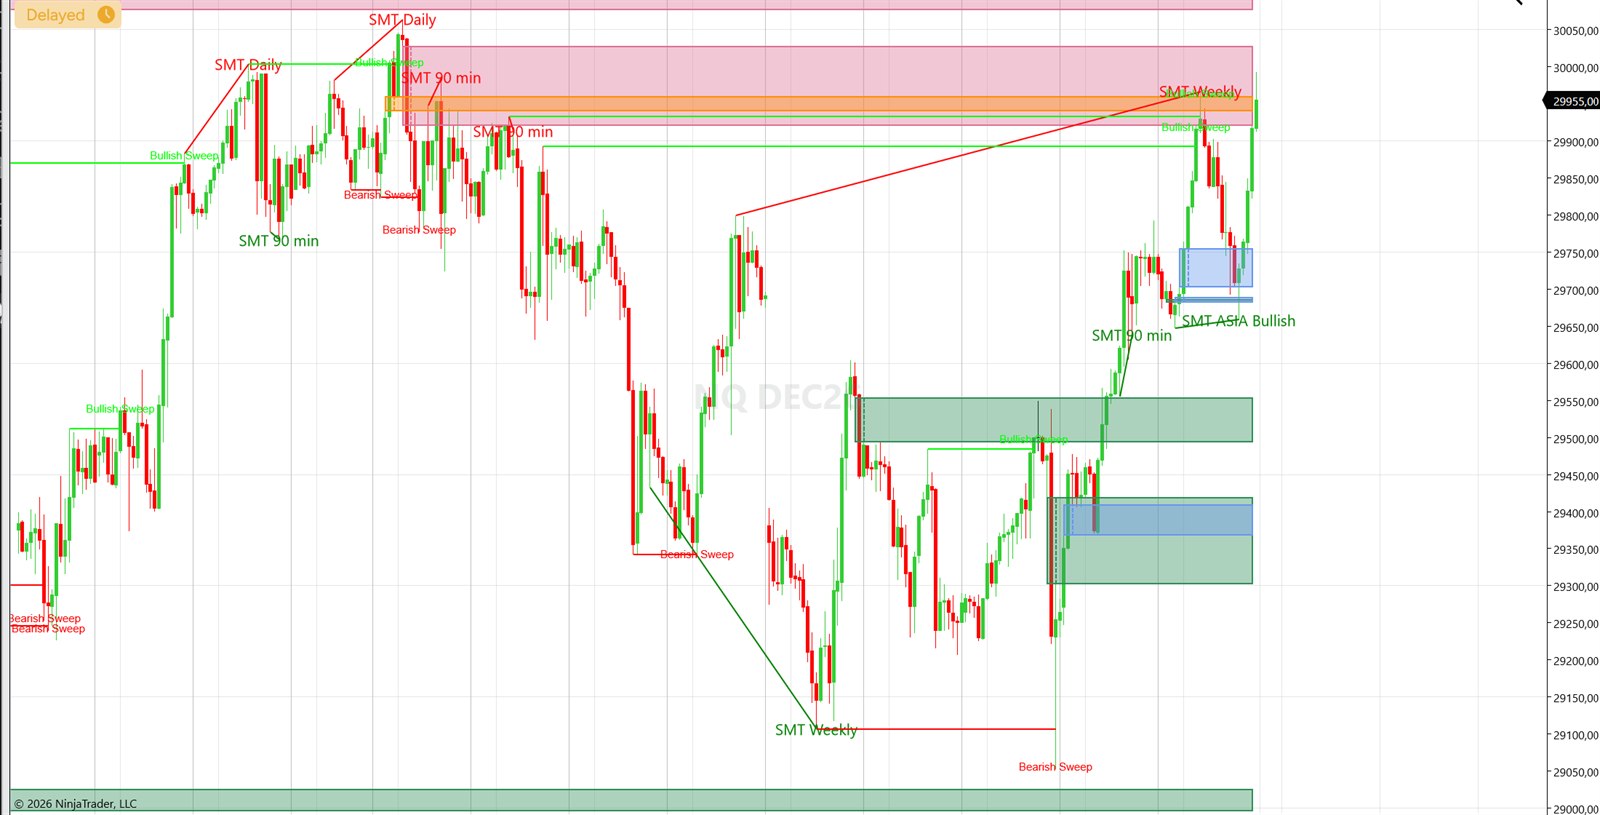
Before the move, the raid. This indicator qualifies swing highs and lows, watches for the wick that takes them out, and only calls it a sweep when price displaces back through — which is exactly what separates a reversal from a breakout that keeps going.
- Qualified swing points — swing strength and a minimum distance between levels, so only real liquidity counts
- Validation types — wick, close, or bar-based confirmation of the raid
- Displacement requirement — a minimum move back through the level in ticks before the sweep is accepted
- Time and distance limits — maximum bars to validate and maximum distance from the liquidity pool
- Session reset — optionally clear tracked levels at the end of each day
- Full labelling — bullish and bearish sweeps drawn with arrows, lines and text
One confluence, six confirmations
Traded by hand, these indicators give you the whole picture: a raid on liquidity, SMT against ES, a higher-timeframe zone in play, and an inversion to enter from. Traded by algorithm, that same confluence becomes an order.
Checkout opens on Whop shortly — the button takes you to the Discord to reserve your seat.